Arctic sea ice extent for December 2012 remained far below average, driven by anomalously low ice conditions in the Kara, Barents, and Labrador seas. Thus far, the winter has been dominated by the negative phase of the Arctic Oscillation, bringing colder than average conditions to Scandinavia, Siberia, Alaska, and Canada.
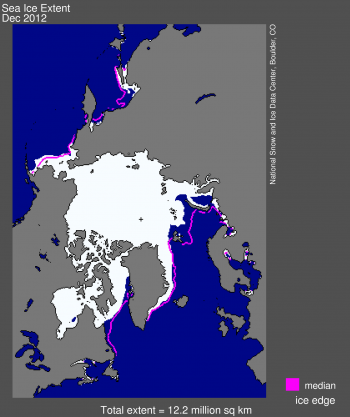
The average sea ice extent for December 2012 was 12.20 million square kilometers (4.71 million square miles). This is 1.16 million square kilometers (448,000 square miles) below the 1979 to 2000 average for the month, and is the second-lowest December extent in the satellite record.
At the end of December, ice extent in the Atlantic sector remained far below normal, as parts of the Kara and Barents seas remained ice-free. Ice has also been slow to form in the Labrador Sea, while Hudson Bay is now completely iced over. On the Pacific side, ice extent is slightly above normal, with the ice edge in the Bering Sea extending further to the south than usual. The Bering Sea has seen above-average winter ice extent in recent years and is the only region of the Arctic that has exhibited a slightly positive trend in ice extent during the winter months.
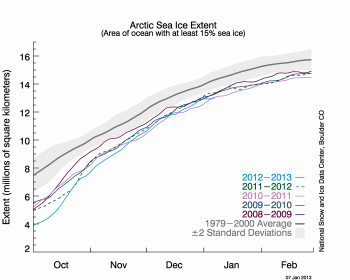
Figure 2. The graph above shows Arctic sea ice extent as of January 7, 2013, along with daily ice extent data for the previous five years. 2012 to 2013 is shown in blue, 2011 to 2012 in green, 2010 to 2011 in pink, 2009 to 2010 in navy, and 2008 to 2009 in purple. The 1979 to 2000 average is in dark gray. The gray area around this average line shows the two standard deviation range of the data. Sea Ice Index data.
Although the Arctic gained 2.33 million square kilometers of ice (900,000 square miles) through the month, ice extent in the region remained far below average. Ice growth remained slow in the Kara and Barents seas where air temperatures were 3 to 5 degrees Celsius (5 to 9 degrees Fahrenheit) higher than normal. Air temperatures over Greenland and the Canadian Archipelago were also slightly above average, while temperatures over Alaska were 2 to 7 degrees Celsius (4 to 13 degrees Fahrenheit) lower than average.
Winter sea ice variability is largely confined to the peripheral seas surrounding the Arctic Ocean. In the past, the dominant pattern of winter sea ice variability showed a distinct out-of-phase relationship between the Labrador and Greenland-Barents seas, with a less prominent seesaw pattern in the Pacific sector, between the Bering Sea and the Sea of Okhotsk. In recent winters however, this out-of-phase relationship no longer appears to hold in the Atlantic sector. Ice extent has remained below average in both the Labrador and the Barents seas.
Successive winters with anomalously low sea ice in the North Atlantic have led to higher mortality rates for seals in the region. The United States government recently added the bearded and ringed seals to the list of creatures threatened under the Endangered Species Act.
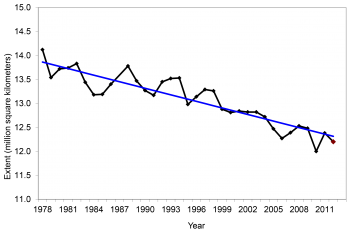
Figure 3. Monthly December ice extent for 1979 to 2012 shows a decline of -3.5 percent per decade.
Average Arctic sea ice extent for December 2012 was the second lowest for the month in the satellite record. Through 2012, the linear rate of decline for December ice extent is -3.5 percent per decade relative to the 1979 to 2000 average. While the winter ice extent for the Arctic as a whole shows only modest declines, large negative trends are now found in nearly all of the peripheral seas, with the exception of the Bering Sea.
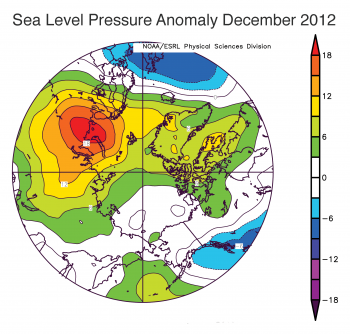
Figure 4. This image shows sea level pressure anomalies averaged for December 2012, compared to averages over the period 1981 to 2010. Sea level pressure was above average over Eurasia, extending into the Kara and Barents seas, and across Greenland and the Canadian Archipelago.
The most important mode of variation in the Arctic’s winter atmospheric circulation is the Arctic Oscillation. When the Arctic Oscillation is in a negative mode or phase, sea level pressure is higher than normal over the central Arctic and lower than normal over middle latitudes. This pattern tends to keep the high Arctic relatively warm. It brings colder weather to Europe and North America because air masses can cross into and out of the high Arctic more easily. This pattern tends to favor the retention of thick ice in the Arctic basin by reducing the outflow of ice through the Fram Strait and strengthening the Beaufort Gyre, a clockwise circular pattern of ice drift in the central Arctic. The opposite conditions generally hold for a positive Arctic Oscillation pattern.
The specific influence of this winter’s negative Arctic Oscillation will depend not only on the strength of the sea level pressure anomaly, but also on the location of the sea level pressure center of action. While a negative Arctic Oscillation pattern tends to favor more ice in summer, this was not the case during the extreme negative Arctic Oscillation winter of 2009 to 2010.
The overall effect on the ice cover remains to be seen. Recent studies have argued that that strong warming of the atmosphere in autumn from summer sea ice loss favor the negative Arctic Oscillation phase.
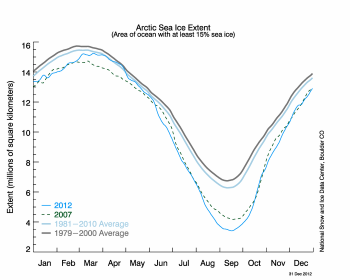
Figure 5. The graph above shows January to December Arctic sea ice extent for the two lowest extent years in the satellite record. Year 2012 is shown in blue and 2007 is shown in green. The 1981 to 2010 average is shown in light blue while the 1979 to 2000 average is in dark gray. Sea Ice Index data. About the data
While the year began with lower than average extent for the Arctic as a whole, extent in the Bering Sea was at record high levels for much of the winter. The seasonal decline of ice extent began slowly, such that in mid-April, extent for the Arctic as a whole was briefly near average levels.
Extent began dropping rapidly beginning in May, and by the end of the melt season on September 16, extent was at the lowest level recorded in the satellite record of 3.41 million square kilometers (1.32 million square miles). While summer weather conditions were not as favorable for ice loss as during 2007, the year of the previous record low, an unusually strong cyclone in August helped to quickly break up the already thin and fragmented ice cover in the Chukchi Sea. This cyclone—remarkable in its intensity and its duration—lasted for thirteen days, of which ten days were spent in the Arctic basin.
While it appears that a record low extent would have been reached even without the cyclone, thinning over the last several decades has made the ice more vulnerable to such storms, compared to earlier decades when the Arctic Ocean was dominated by thick, multiyear ice.
The annual average extent is now declining at a rate of -4.5 percent per decade relative to the 1979 to 2000 average and -4.6 percent per decade relative to the 1981 to 2010 average. The 1981 to 2010 period is the 30-year climatology used by the National Oceanic and Atmospheric Administration (NOAA) for their climate normals. Thirty years is a commonly-used period to define average or normal climate conditions. It is long enough to capture much climate variability, such as the different modes of the Arctic Oscillation, and short enough to be relevant for human timescales, such as agricultural cycles. NOAA updates its climate normals every ten years. For Arctic sea ice, use of the 1981 to 2010 period results in a lower extent than the 1979 to 2000 period, as seen in Figure 5, because the low extents of the last decade are included.
Record low ice extent was not the only remarkable event in the north. In June, Northern Hemisphere land snow cover set a new record for the least amount of snow cover in the 45-year record. A month later, the Greenland ice sheet experienced melt over more than 90 percent of its surface area, the largest melt extent recorded during the satellite data record.
Further reading
Simmonds, I. and I. Rudeva. 2012. The great Arctic cyclone of August 2012. Geophysical Research Letters39, L23709, doi:10.1029/2012GL054259.
Jaiser, R., K. Dethloff, D. Handorf, A. Rinke, and J. Cohen. 2011. Impact of sea ice cover changes on the Northern Hemisphere atmospheric winter circulation. Tellus A, 64, 11595, doi:10.3402/tellusa.v64i0.11595.
Stroeve, J. C., J. Maslanik, M. C. Serreze, I. Rigor, W. Meier, and C. Fowler. 2011. Sea ice response to an extreme negative phase of the Arctic Oscillation during winter 2009/2010, Geophysical Research Letters 38, L02502, doi:10.1029/2010GL045662.
No comments:
Post a Comment
Enter your comment(s) here...